Monitor queries & conversations
This guide explains how to monitor your platform’s queries and conversations to track usage and evaluate performance.
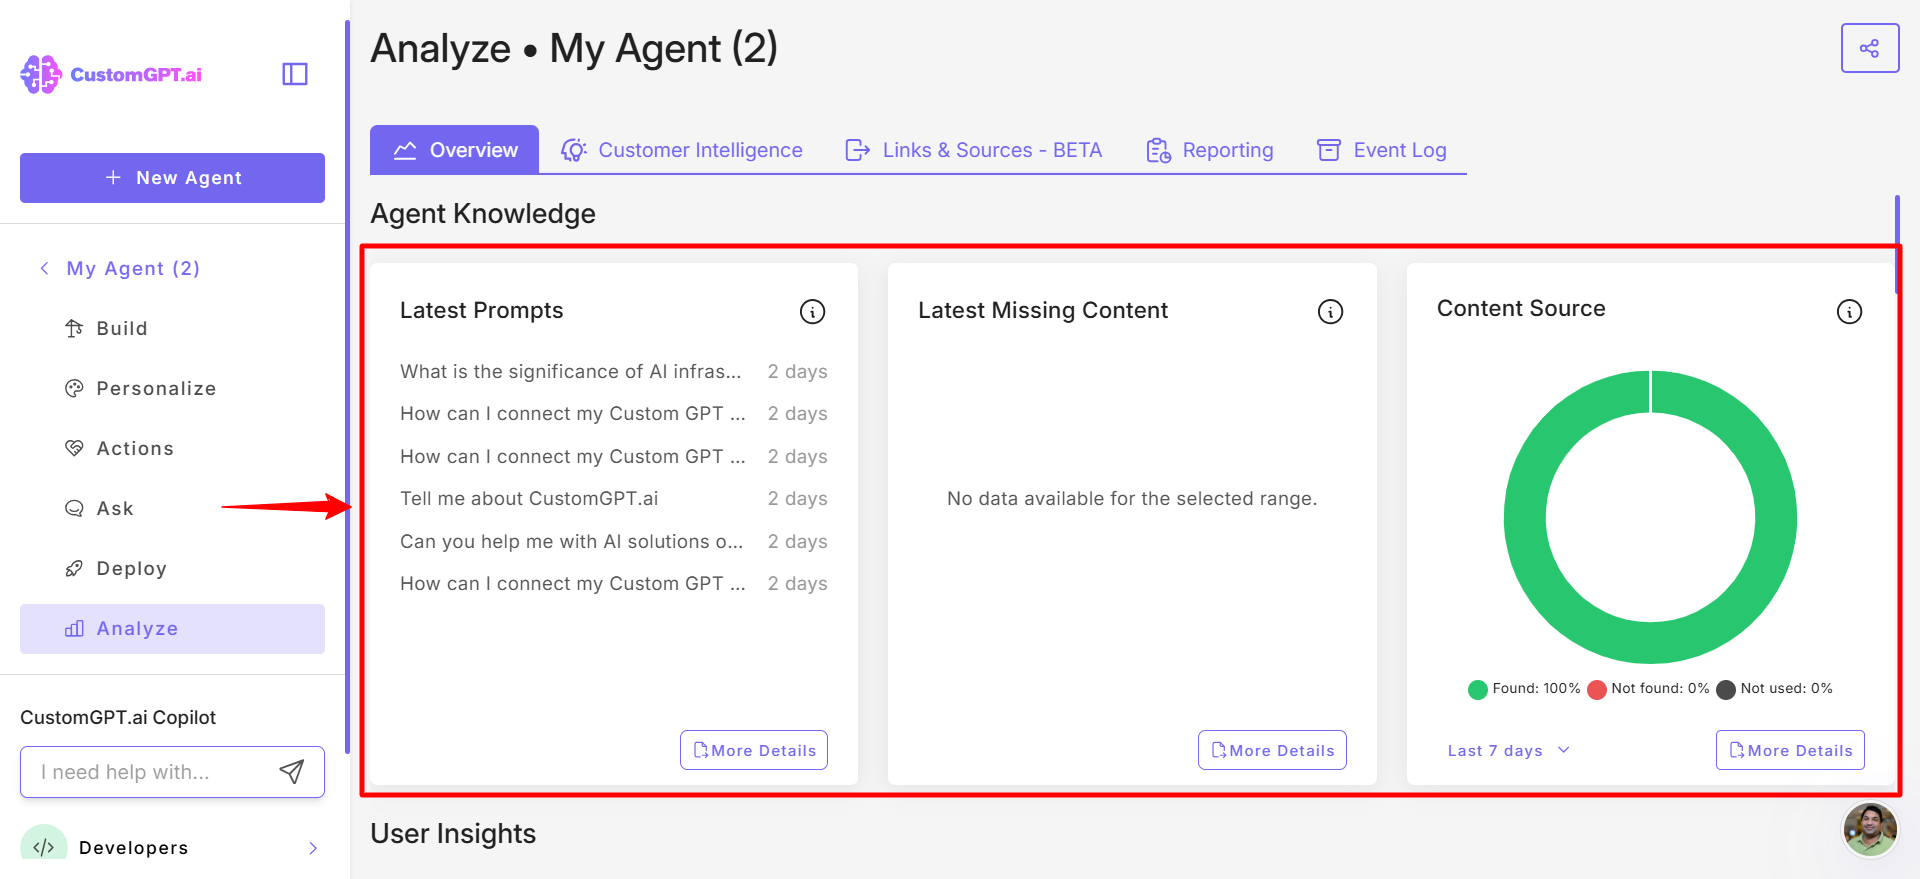
- Navigate to Agent Analytics.
- In Agent Knowledge, you can view Latest Prompts, Latest Missing Content, and Content Source.
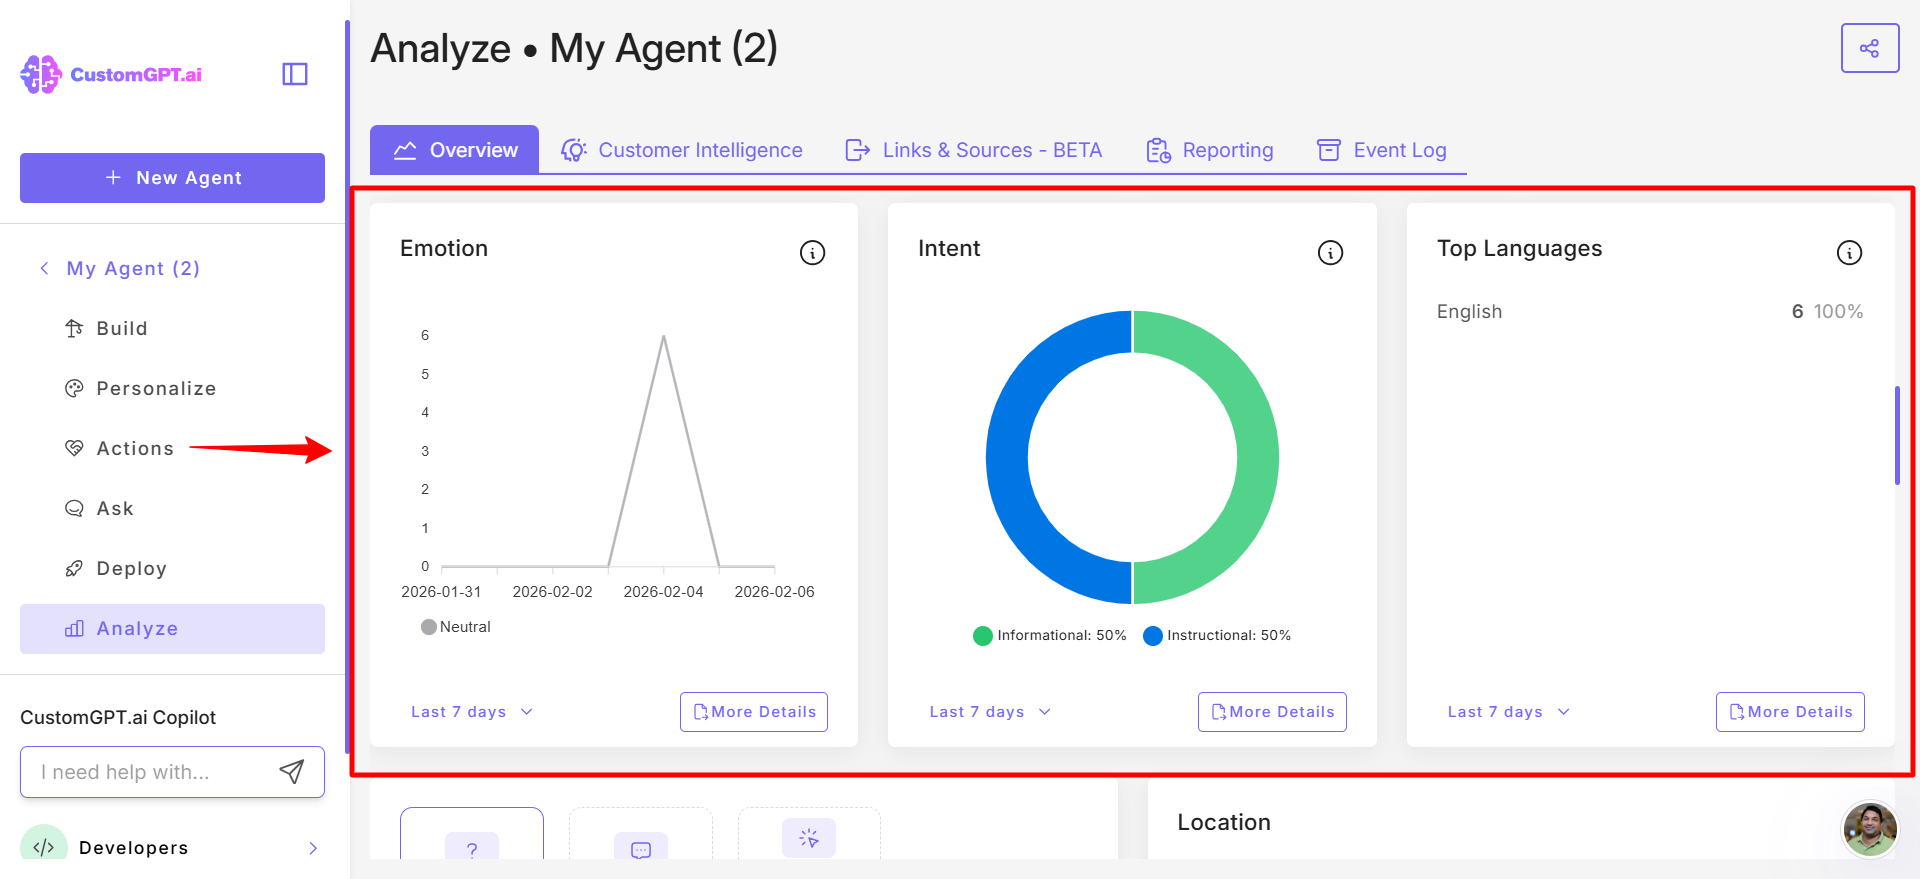
- In User Insights, you can view Emotion, Intent, and Top Languages.
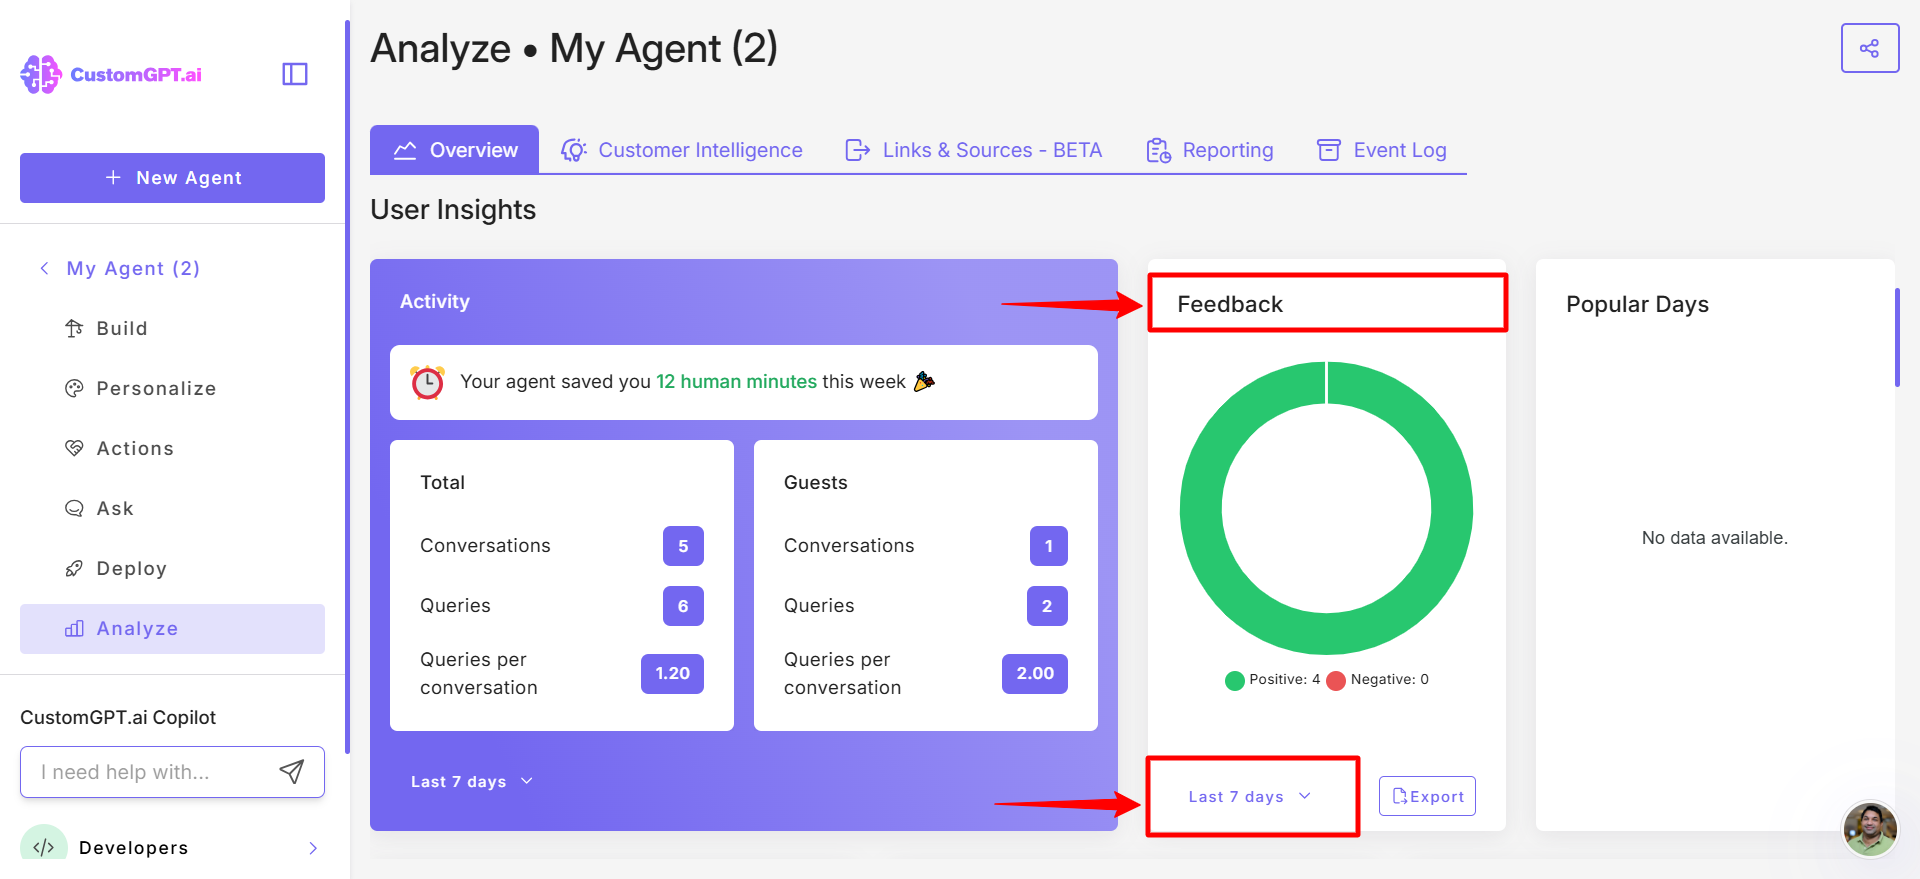
- Under Total and Guest activity, you can view metrics such as Conversations, Queries, and Queries per conversation.
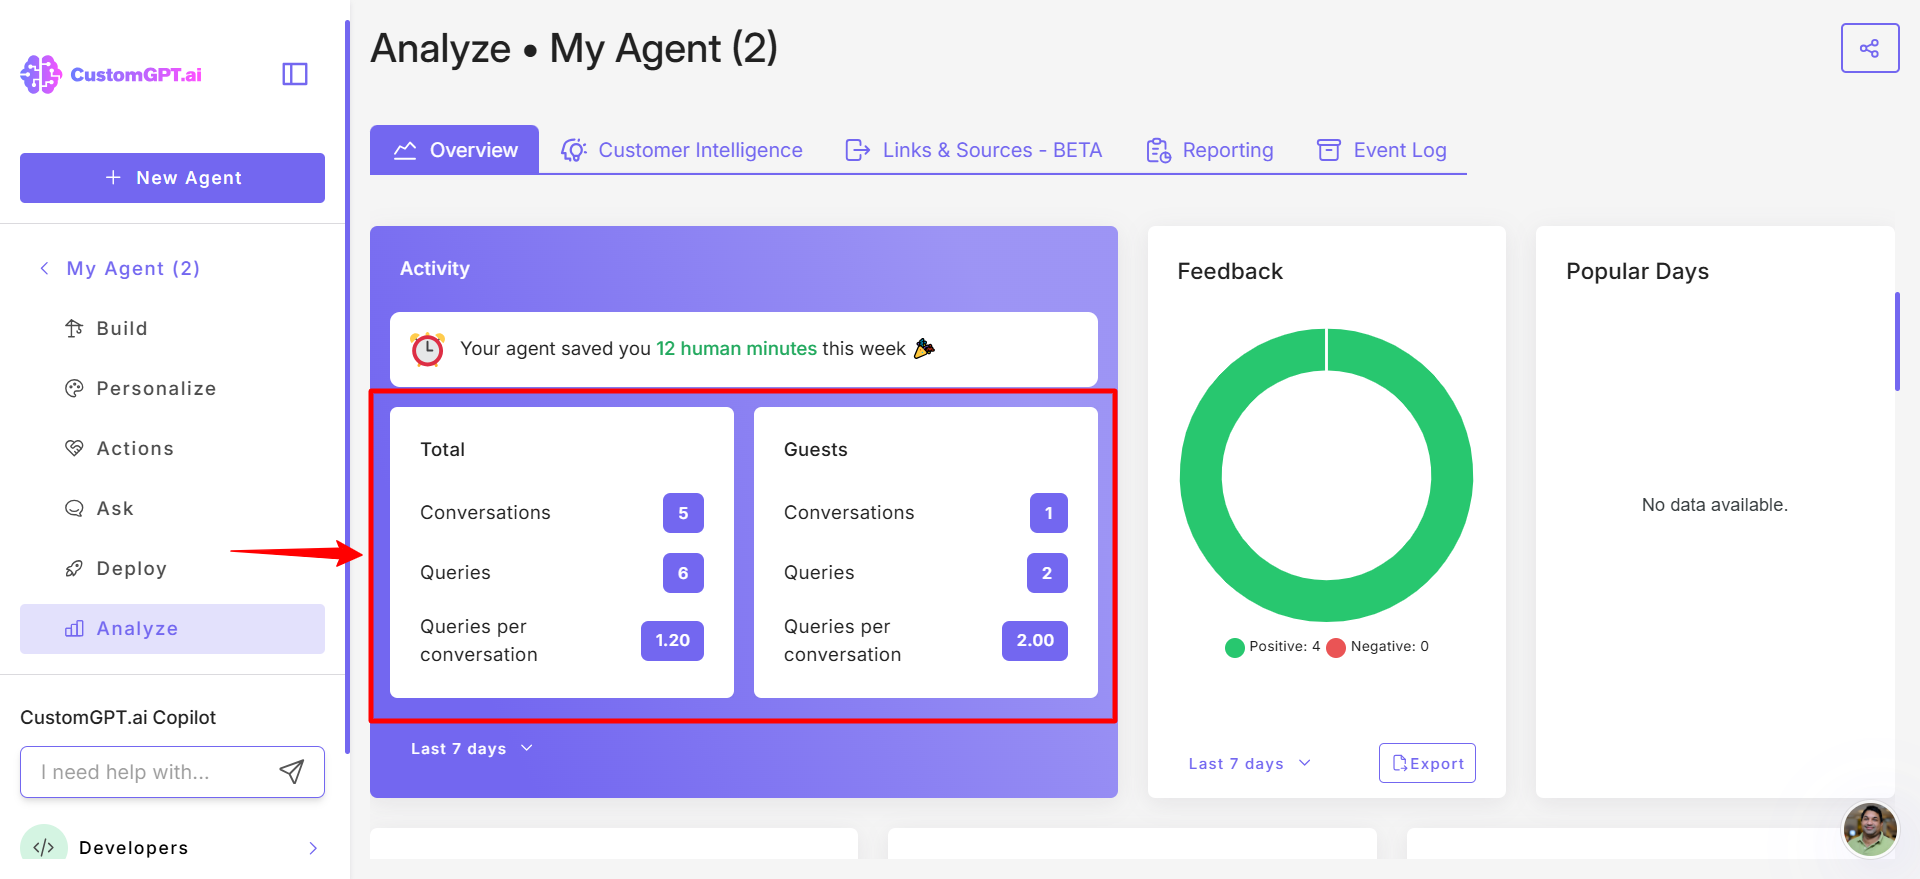
- Use the dropdown menu to filter these metrics by Today, This Week (default), Month, or All Time.
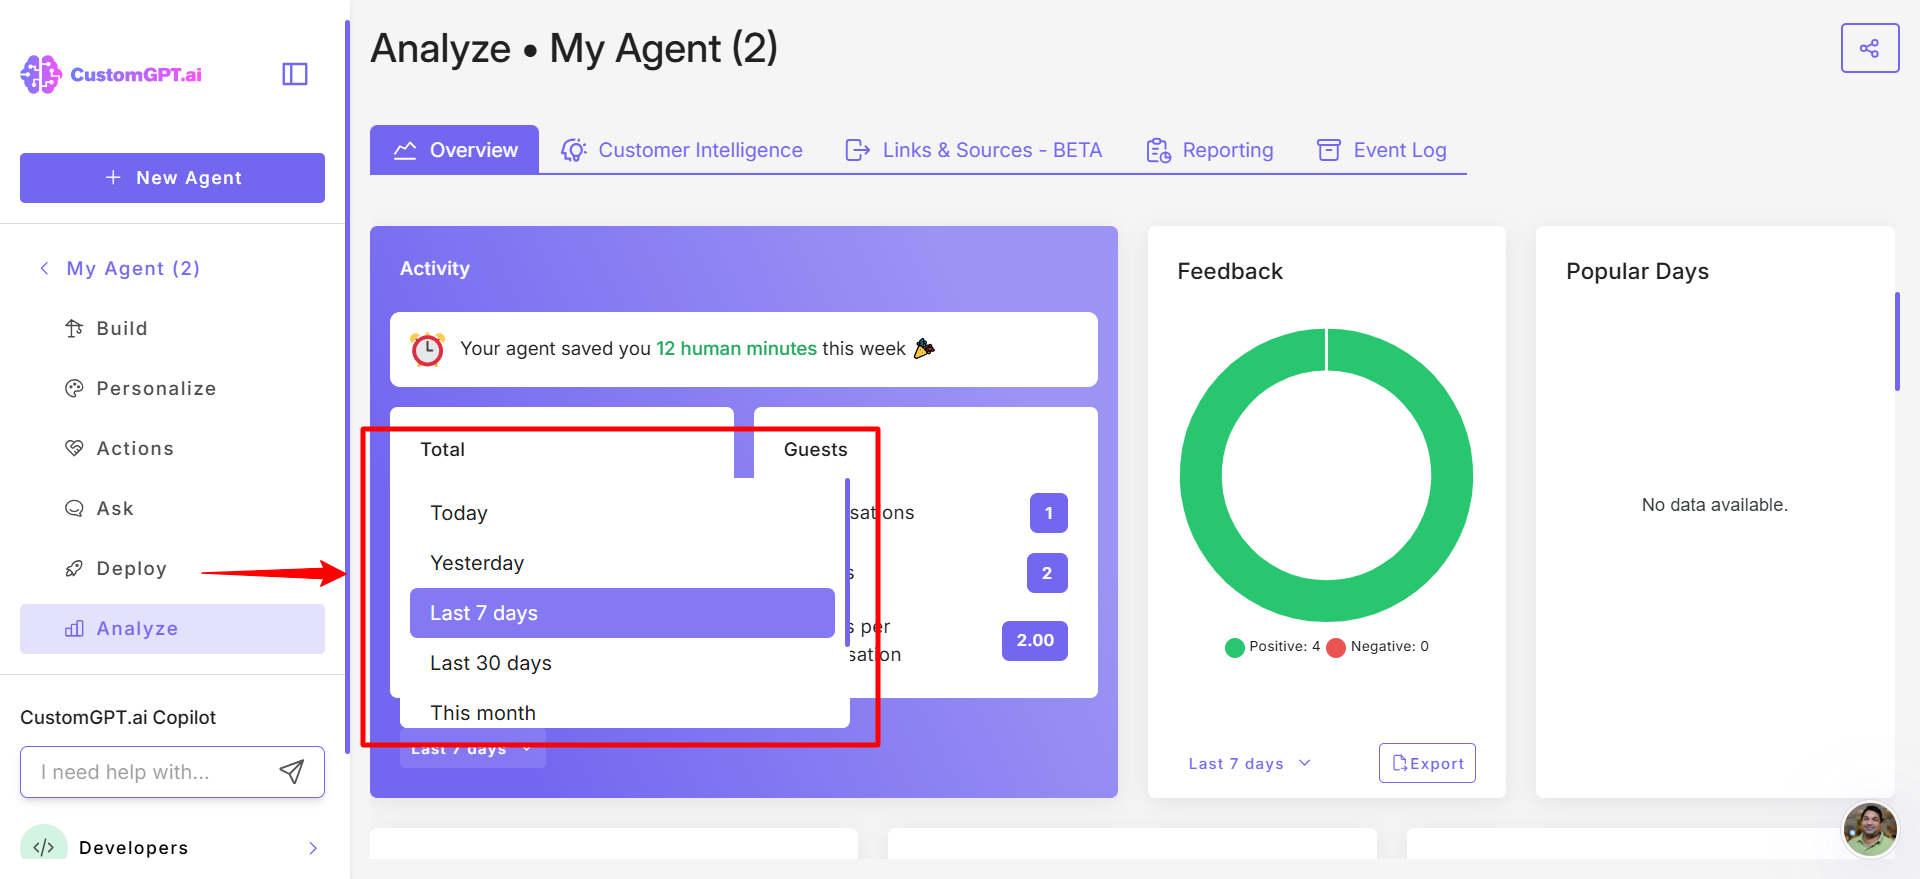
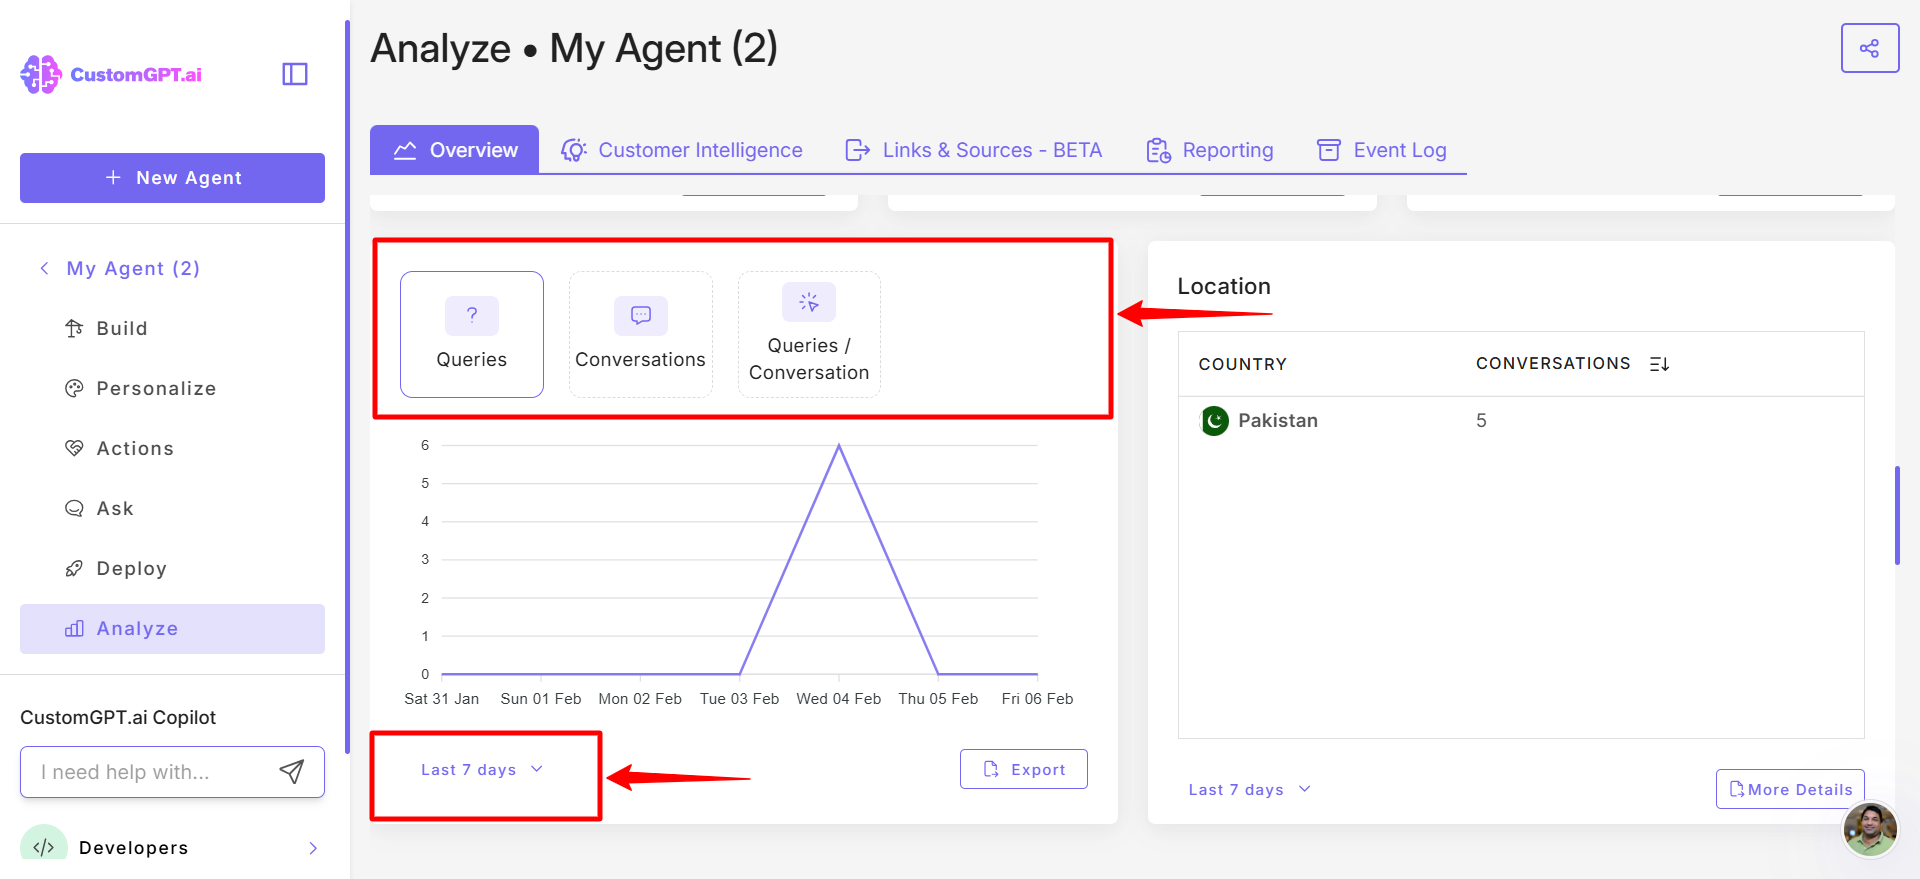
- Scroll down to view the daily breakdown of Queries, Conversations, and Queries per conversation for detailed performance insights. You can filter data by Today, Yesterday, Last 7 days, Last 30 days, Last month, Last year, or a Custom range.
- In the "User Feedback" section, monitor the positive and negative feedback via the thumbs up/down system. Select a timeframe from the dropdown menu to view corresponding User Engagement metric.
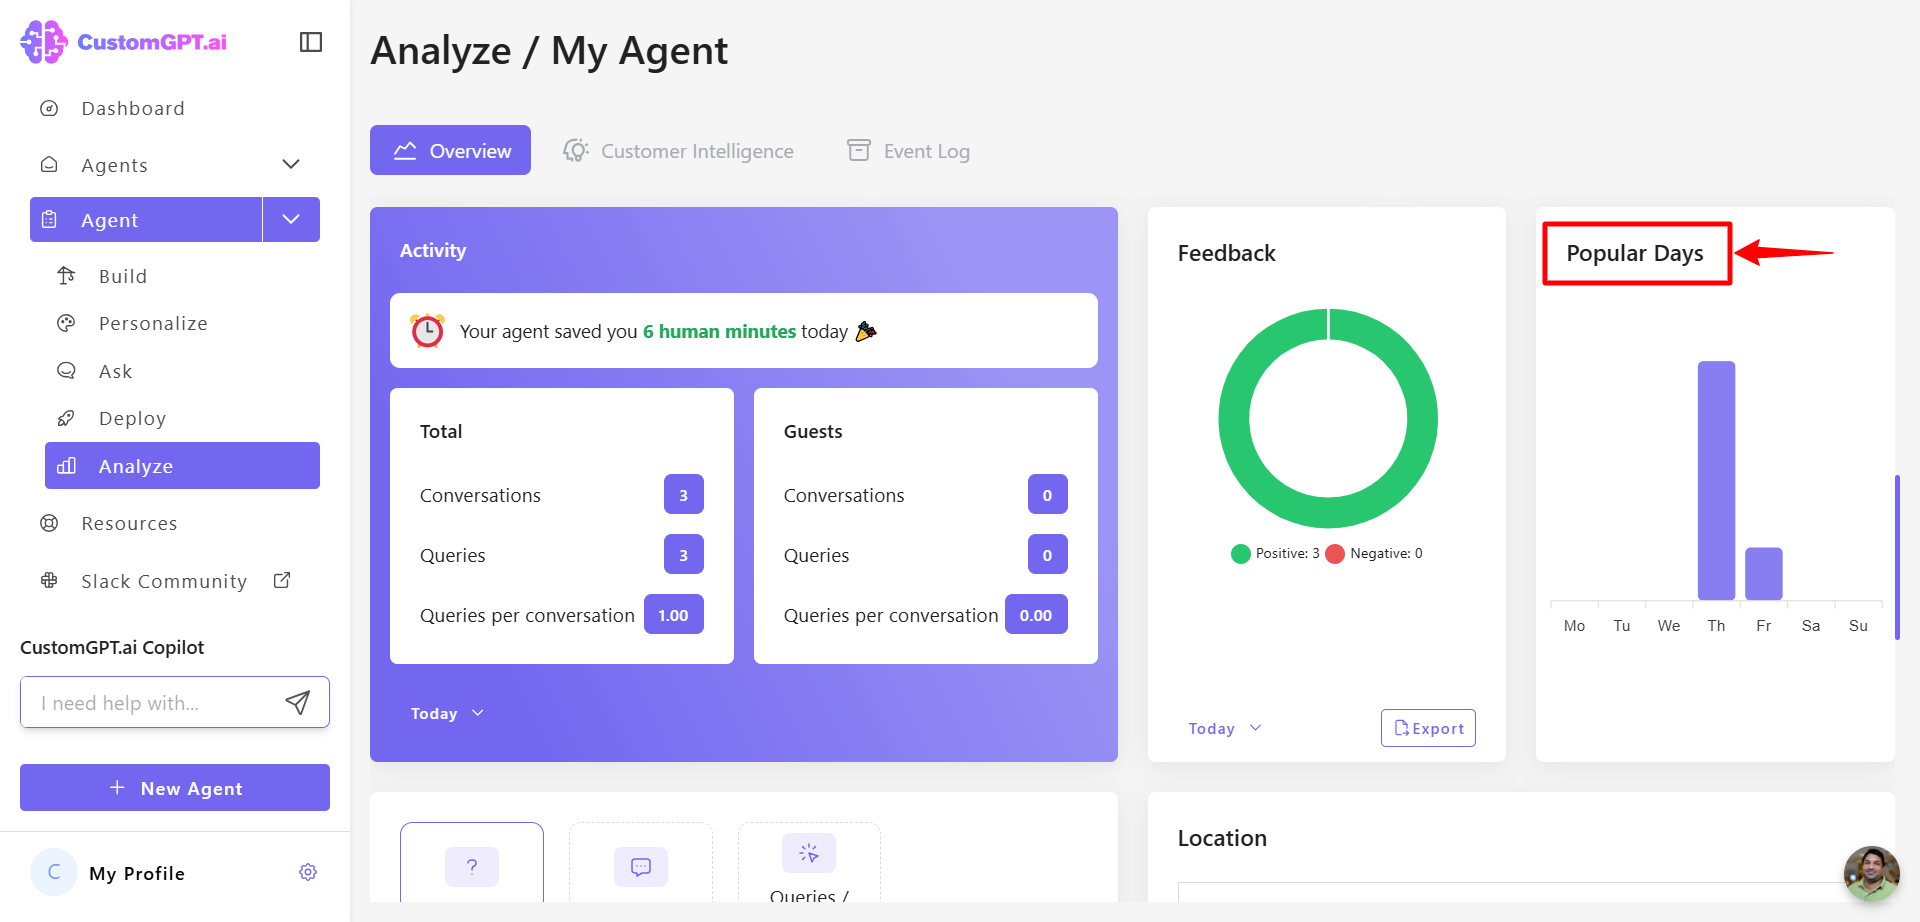
- View the Popular Days.
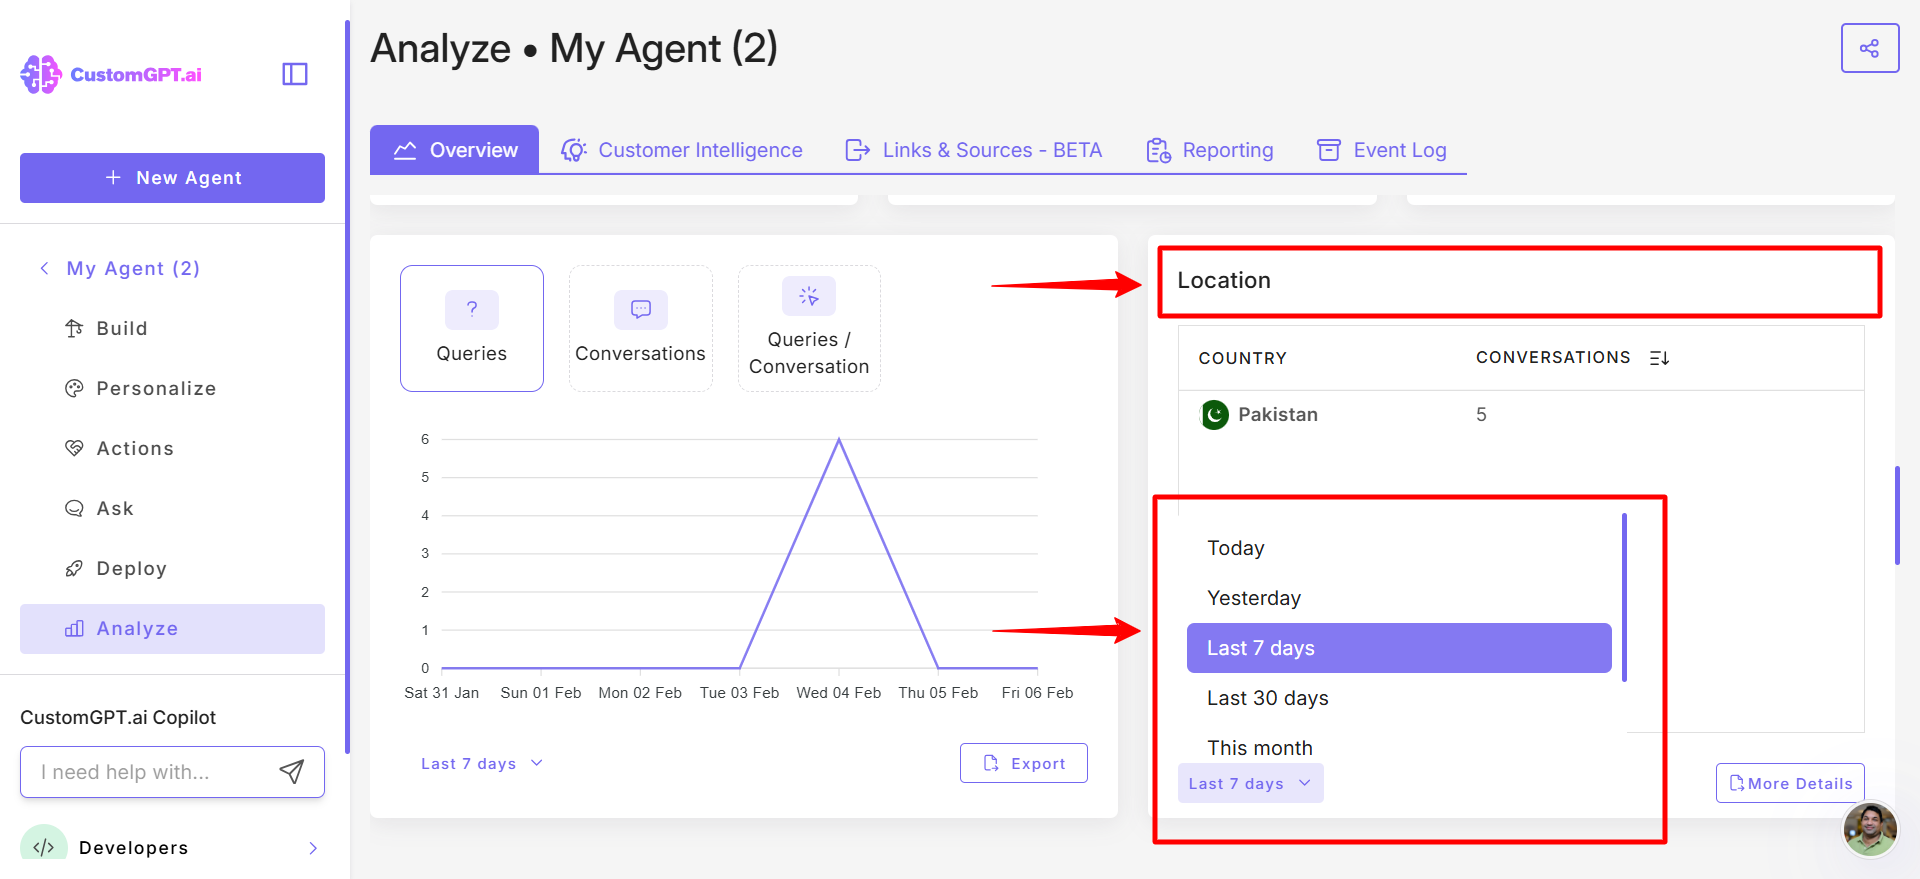
- In User location, you can view where your users are located. Filter the data by Today, Yesterday, Last 7 days, Last 30 days, Last month, Last year, or a Custom range.
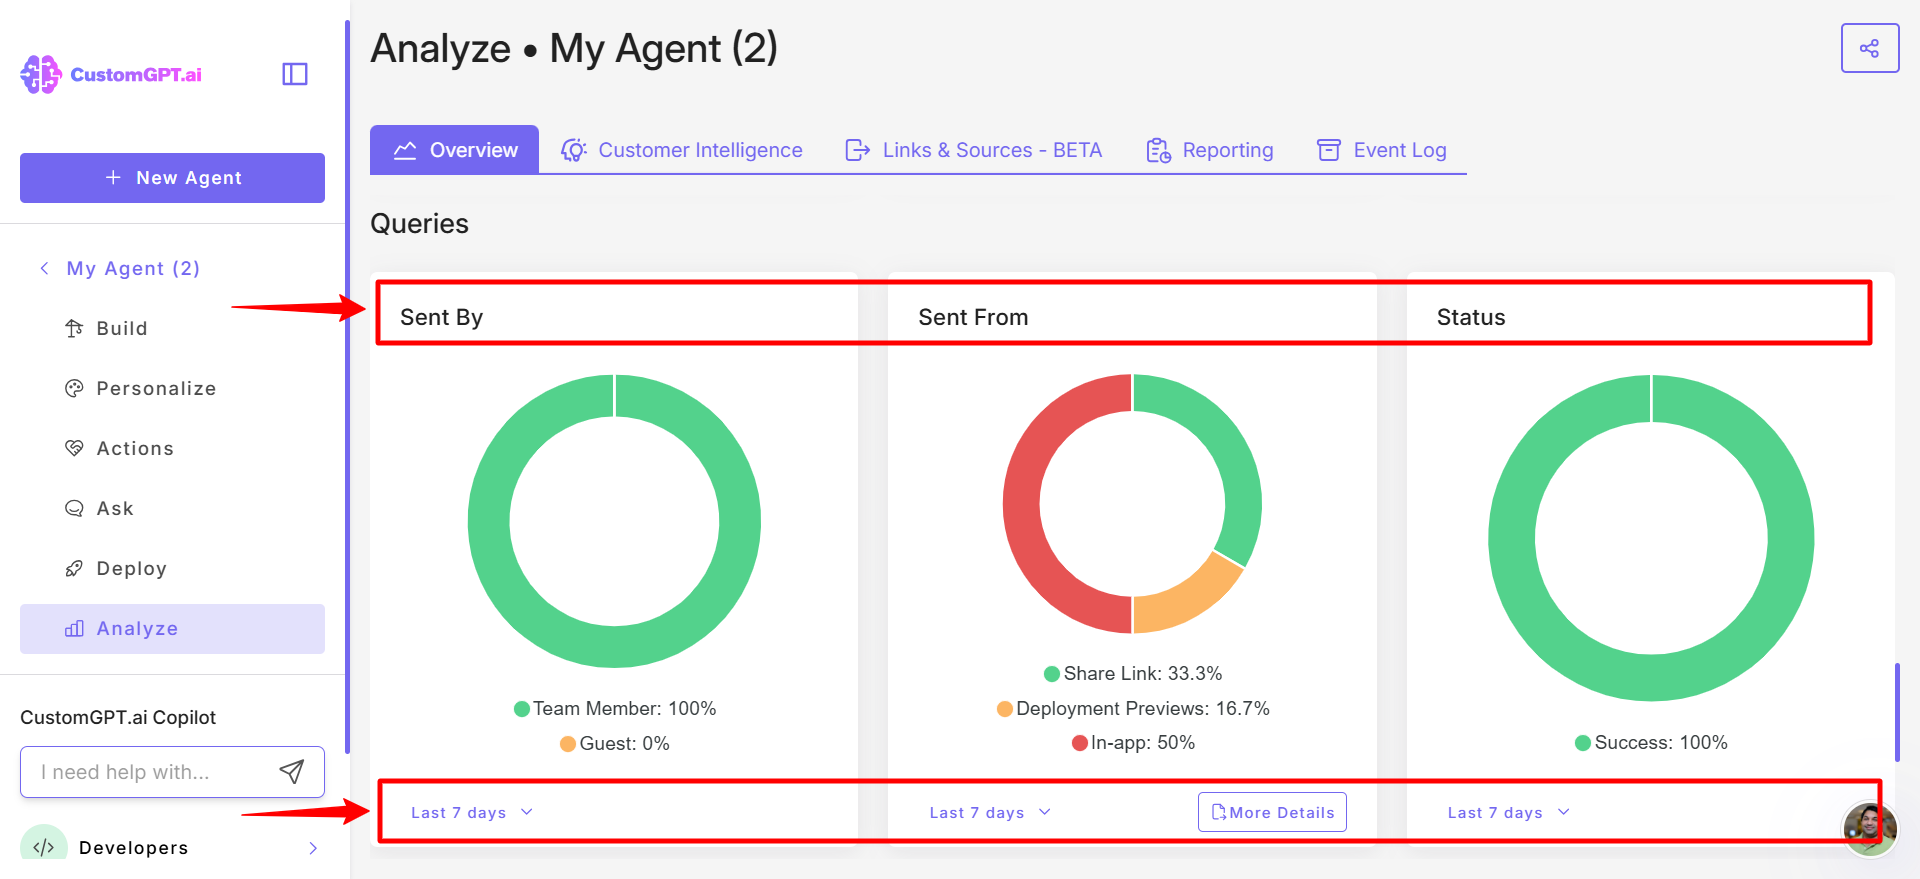
- Additional insights consistent with the current analytics interface, such as Sent By (team members or guest), Sent From, and Query Statuses (success or failure), are displayed in pie charts at the bottom of the page. You can filter the data by Today, Yesterday, Last 7 days, Last 30 days, Last month, Last year, or a Custom range.
Updated 6 months ago
Did this page help you?