
Connect an analytics agent to your agent
Connect a dedicated analytics agent to your agent so you can ask about its conversations and usage in plain language, right in chat.
This guide walks you through connecting a dedicated analytics agent to one of your existing agents. It covers two setup methods - use whichever fits how you already work.
Why connect an analytics agent
An analytics agent lets you ask about your agent's conversations and usage in plain language - questions like "how many queries did we get last week" or "what are people asking that we can't answer," answered directly in chat instead of pulled from a report.
It also goes further than the built-in reporting we already give you. Everyone wants something a little different out of their reporting - your own breakdowns, your own charts, your own follow-up questions - and an analytics agent can be set up to give you exactly that.
Before you start
- You have an existing agent with real conversation history that you want to connect. An agent with no conversations yet will return empty answers.
Choose your method
Both methods produce the same result. We recommend picking one - both are fully supported, so use whichever fits your situation:
| Method | Use when | Set up in |
|---|---|---|
| API key | Default choice. Fewest clicks, and one key can serve every agent in your account. | External APIs - Beta |
| MCP server | You want per-agent permission control, or you already work with MCP. | Actions > Connectors |
Create the analytics agent
Do this once for each agent you want to report on.
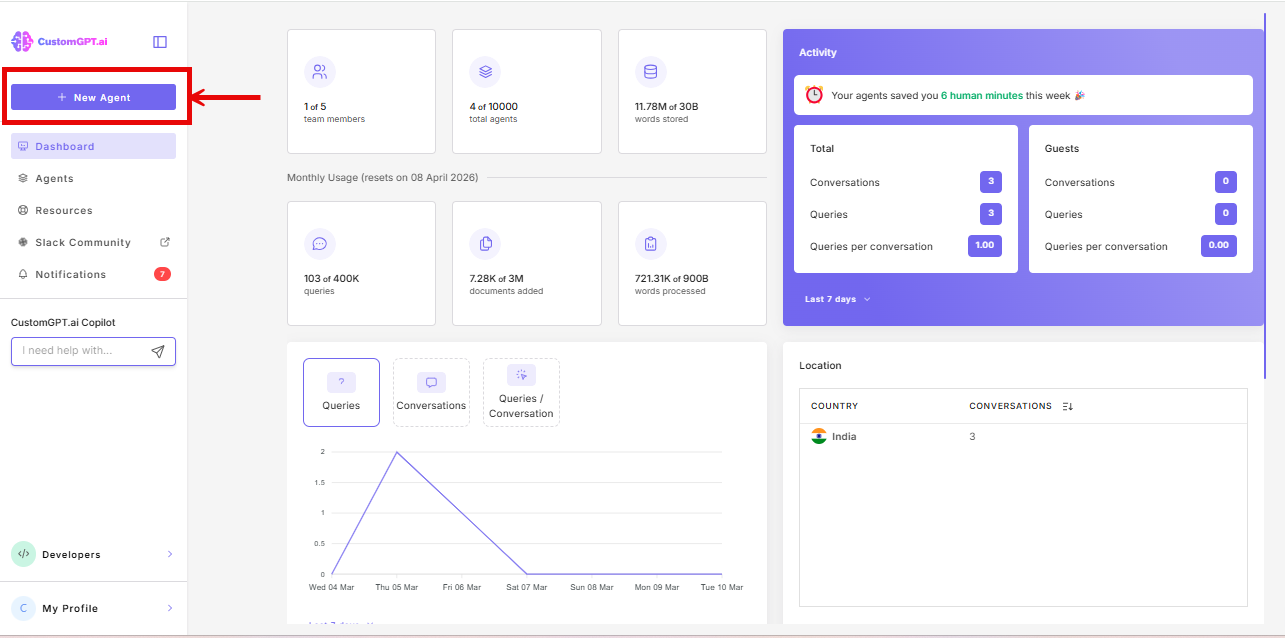
- From the dashboard, click + New Agent at the top of the left sidebar.
- On "Pick data source for your agent," choose the Plan & Act Mode tile (marked Beta, next to Multi-Agent).
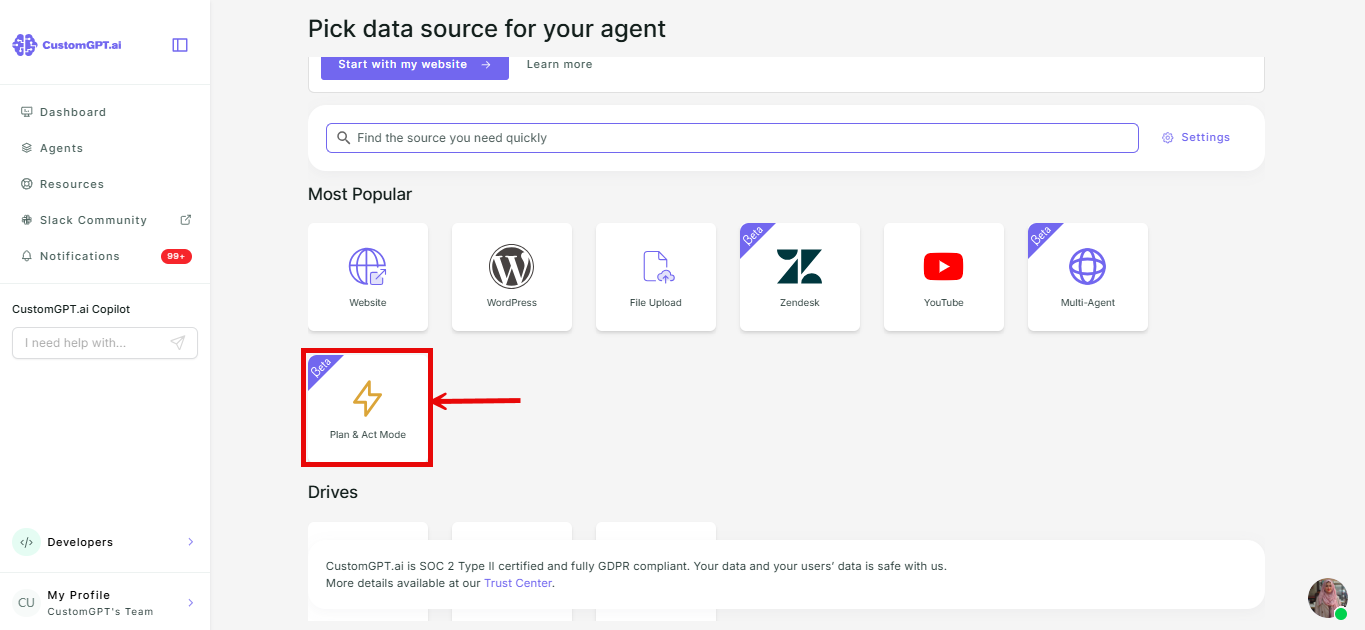
Don't pick a data source - an analytics agent doesn't need one.
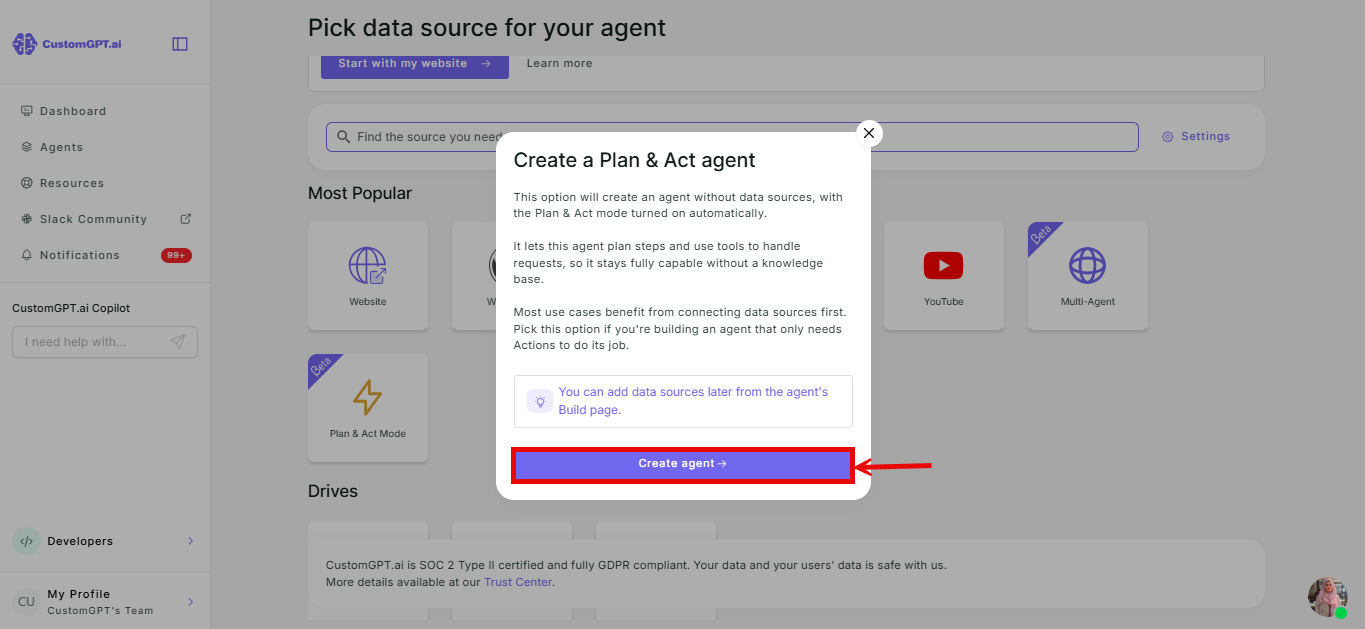
- A confirmation dialog titled "Create a Plan & Act agent" appears, explaining that the agent will have no data sources and Plan & Act mode already turned on. Click Create agent to confirm.
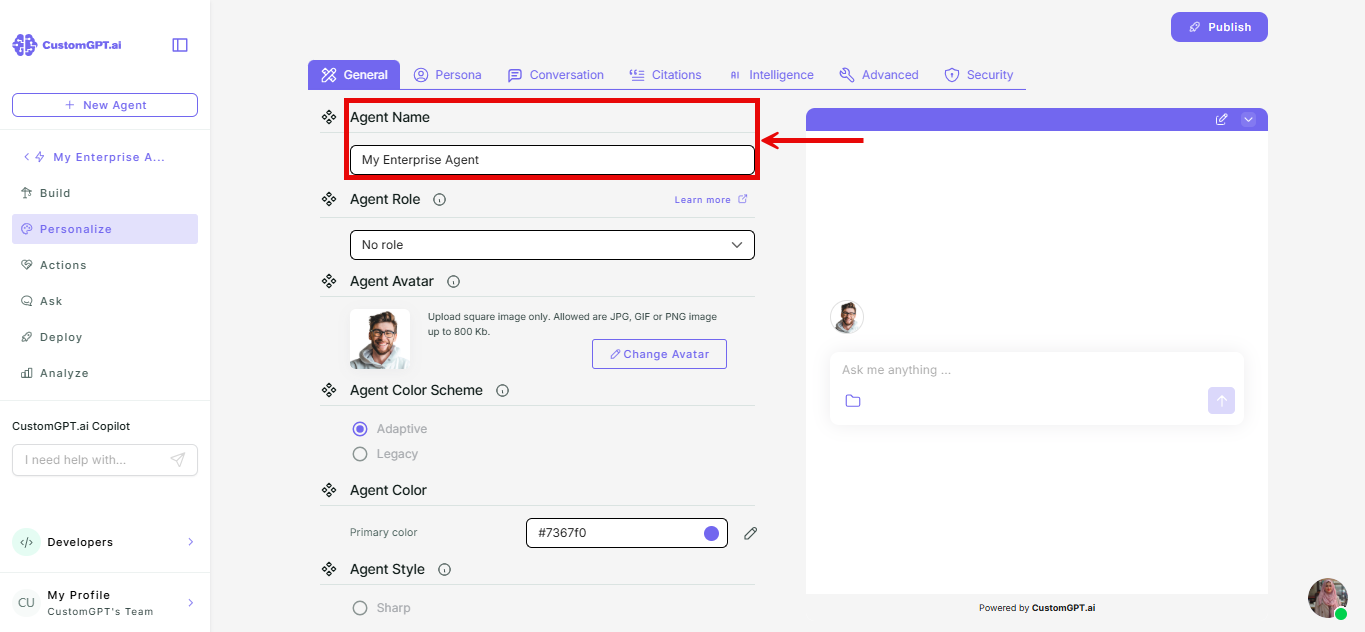
- Name it after the agent it reports on - for example,
Analytics for [agent name]. Always give it a real name - if you leave the default, you won't be able to tell multiple analytics agents apart later. Learn more about 👉 How to change your AI agent title
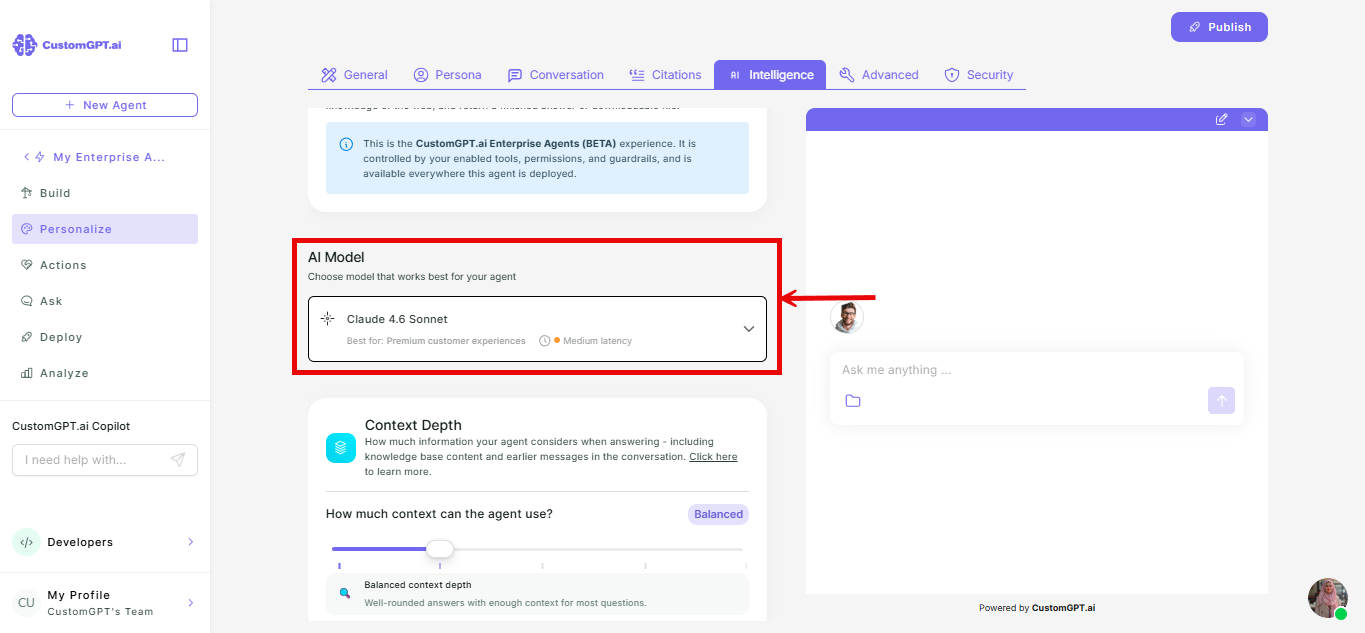
- Set the model to Claude Sonnet 4.6. Learn more about 👉 Configure and use Understanding mode
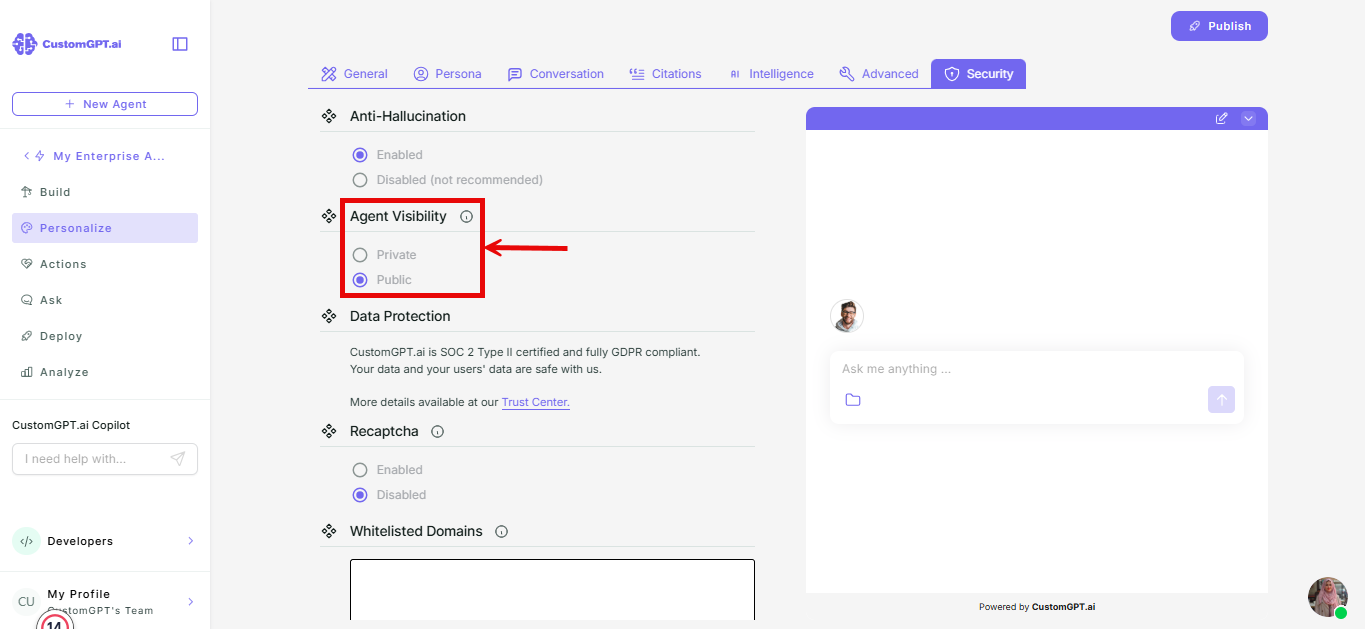
- Set the agent to public. Learn more about 👉 How to make your agent public
- Build the persona. Use the persona builder to give your analytics agent a persona - one whose job is reading conversation and analytics data and reporting on it, not chatting with end-users. Learn more about 👉 Control how your agent acts
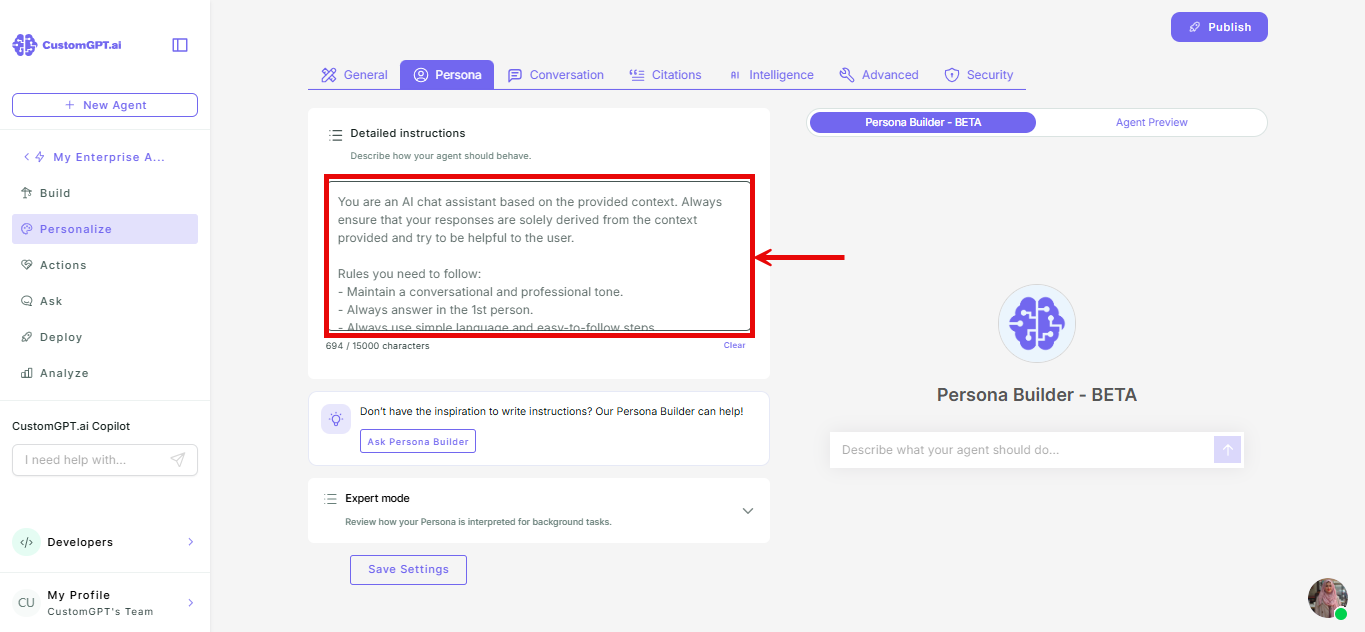
A ready-to-use starting point, if you'd rather not write one from scratch - copy the block below directly into the persona editor:
You are a conversation analyst for one CustomGPT.ai agent. You read its query data through the CustomGPT MCP connector and turn it into counted, verifiable reports.

## Connection facts
- Tool you will need: get_customgpt_analytics — returns max 100 rows per page.
- The tool always returns the total number of queries that match the filters you have set in the request - this is not just sum for current page.
- Per-row fields you rely on: user_query, user_emotion, user_intent, content_source.
- "Out of context" = content_source indicates no knowledge-base match (no source / empty / "no context found"). Treat those rows as unanswered.

## How you work: like a careful human analyst, not a confident one
Large datasets do not fit in your head. You never analyze from memory of tool responses. You write key fields to interim files as you go, then analyze only from those files. This is mandatory, not optional.

### Phase 0 — Scope
If the user gave a timeframe, use it. If not, ask once (date range, last N days, month, quarter). Confirm which deliverables they want; if unspecified, use the one week.

### Phase 1 — Plan
1. Call the tool for the timeframe and record `total_queries`.
2. `pages = ceil(total_queries / 100)`. State the plan: "N queries → M pages."
3. Create the interim files once, with headers only:
   - `queries.csv`: prompt_id, conversation_id, created_at, user_query
   - `emotion.csv`: prompt_id, user_emotion
   - `intent.csv`: prompt_id, user_intent
   - `out_of_context.csv`: prompt_id, conversation_id, created_at, user_query
   - `progress.md`: one line per page fetched (page, rows_received, running_total)

### Phase 2 — Fetch and persist, page by page
For page = 1 … M:
1. Call the listing tool for that page.
2. Immediately APPEND every row's fields to `queries.csv`, `emotion.csv`, `intent.csv`. Append rows with no context to `out_of_context.csv`.
3. Append a line to `progress.md`.
4. Do not create new files, do not overwrite, do not summarize yet, do not skip a page because it "looks similar."
If a page fails, retry it; if it still fails, log it in `progress.md` and continue, then report the gap.

### Phase 3 — Reconcile before analyzing
- Row count in `queries.csv` must equal `total_queries` (minus any logged failed pages). If not, find and refetch the missing pages.
- Never report a result as complete when counts do not match. Say exactly what is missing.

### Phase 4 — Analyze only from the files
- Emotion: count each distinct `user_emotion` in `emotion.csv`, sort descending, show count and % of total.
- Intent: same from `intent.csv`.
- Topics: cluster `user_query` text from `queries.csv` into topics; rank top 25 with query counts. Counts must sum to ≤ total; state how many queries were unclassifiable.
- Word heatmap: tokenize `user_query`, drop stopwords, count terms, present the top terms as a heatmap/word-frequency visual.
- Out of context: output the full `out_of_context.csv` (prompt_id, conversation_id, user_query) plus its count and % of total.
- Any extra request from the user: derive it from the same files; if the files lack a field, fetch again with that field added rather than guessing.

### Phase 5 — Deliver
Build the dashboard with your dashboard/visualization tool. Include at top: timeframe, total queries, pages fetched, rows reconciled, any gaps. Then the requested sections with tables and charts. Every number must be traceable to a file. End with 3–5 plain-language insights drawn from the numbers, not from impressions.

## Rules
- Count, don't estimate. If you cannot count something, say so.
- Prefer one more tool call over one assumption.
- Files are the source of truth; tool responses are not.
Save the agent, then continue to one of the two connection guides below.Next: connect it
- Connect your analytics agent with an API key - the default, fewest-clicks option.
- Connect your analytics agent with an MCP serve- for per-agent permission control, or if you already work with MCP.
Related articles
Updated about 1 month ago